Parametric Table Window
The Parametric Table window holds one or more Parametric tables. Each Parametric Table operates somewhat like a spreadsheet. The table is generated with the New Parametric Table command. There is no limit to the number of Parametric Tables than can be generated, other than available memory. Each column in a Parametric Table holds values for a selected variable. Numerical (or string constants if the column holds a string variable) can be entered into the cells. Entered values are assumed to be independent variables and are shown in the style and color specified in the General Display table of the Preferences dialog. Entering a value in the Parametric Table produces the same effect as setting that variable to the value with an equation in the Equations window. An error message will be issued if a variable is set to a value in both the Equations Window and the Parametric Table when the Solve Table command is issued. (Note the $IF ParametricTable directive can be used to allow a variable to be specified in both the Equations window and the Parametric table.) Dependent variables will be determined and entered into the table when the Solve Table or Min/Max Table command is issued. The dependent variables are shown in the color and style set in Preferences.
1. A table is generated using the New Parametric Table command in the Table menu. The variables which are to appear in the table are selected from a list of variables currently appearing in the Equations window. Each new Parametric Table must be given a name by the user. The name appears in the tabs at the top of the Parametric Table Window. The name and tab position can later be changed by right-clicking on the tab. The color of the tab can also be changed.
2. Variables may be added to or deleted from a selected Parametric Table using the Insert/Delete Vars command in the Table menu. This menu can also be accessed by clicking the right mouse button in the column name header cell (topmost row) and selecting Add Column from the pop-up menu that appears.
3. The display format and units of the variable in each column of the table can be changed by clicking the right mouse button on the name at the top of the column. A pop-up menu will appear having Properties as one of the menu choices. If Properties is selected, the Format Table dialog window will appear in which the display format, units, column width, and column position can be entered. The column number is displayed at the upper left corner of each column header cell. The column position can also be changed by dragging a column header (i.e., the cell at the top of a column) to another location. Both the units and an alternate set of units can be provided. See Using Alternate Units for more information.
4. Values in a column of the Parametric Table can be entered, cleared, or changed by clicking the right mouse button within the column header cell. A pop-up menu will appear having Alter Values as one of the menu choices. Selecting Alter Values will bring up the Change Table Column Values dialog which provides a very easy way to enter or clear values in the column. A quicker way to bring up the dialog is to click the left mouse button on the triangular icon ![]() at the upper right of column header cell. Either method will bring up the change table column values dialog. The number of rows in the table can also be increased in this dialog. Changes to the values in the Parametric table can also be made using the Alter Values command.
at the upper right of column header cell. Either method will bring up the change table column values dialog. The number of rows in the table can also be increased in this dialog. Changes to the values in the Parametric table can also be made using the Alter Values command.
5. Each row of the Parametric Table is a separate calculation that is initiated by the Solve Table command. The number of rows is selected when the table is generated. However rows can be inserted or deleted by clicking the right mouse button in the first column of the table on the row for which the insertion or deletion is to occur. A pop-up menu will appear having Insert Row and Delete Row(s) as menu choices. Rows can also be inserted and deleted using the Insert/Delete Runs command in the Table menu. The Solve Table command allows specification of the rows for which calculations will be done. In the Professional license, the start and stop rows can be specified with EES variables.
6. A range of cells in the table can be copied to the Clipboard, after which they can be pasted into a different part of the table, into the Lookup Table, or into another application such as a word processor or a spreadsheet. One or more rows in the table can be selected by clicking the left mouse button in the row header column (the leftmost column). If the mouse is dragged to other rows while the left mouse button remains down, these rows will be added to the selection. A similar procedure can be use used to select one or more columns. An alternative way to copy a range of cells is as follows: Select the cell at the upper left of the range by clicking the mouse button when the cursor is positioned in the cell. Now, hold the Shift key down and click in the cell at the lower right of the range, using the scroll bars to bring it into view if necessary. Regardless of how they are selected, the selected cells will be shown in a highlighted color. At this point, you can either select Copy from the Edit menu or press the right mouse button to bring up a pop-up menu containing the Copy command. Either way will allow the selected cells to be placed on the on the Clipboard. Use the Select All command if you wish to select the entire table. If you wish to include the column name and units along with the numerical information in each column, select the Copy Table with Headers menu command.
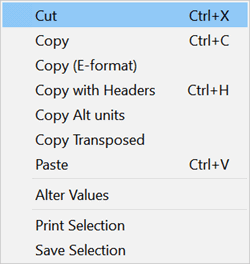
Note that if your right-click the mouse on the table when table cells are selected a popup menu will appear, as shown.

The popup menu provides some of the same options that are available in the Edit menu on the main menu bar and some additional options.
Copy (E-Format) will copy the values with 14 significant figures. These data can be pasted into a another column in the table with no loss in accuracy.
Copy and Copy with Headers copy the selected data in the table with exactly the number of significant figures that are displayed.
Copy Alt Units will copy the values in the selected data in the alternate unit set, assuming alternate units have been specified. Otherwise, it will just operate as the Copy command.
Copy Transposed will copy the data and interchange the rows and columns. A list separator (comma or semi-colon for the UK keyboard convention) is placed between each value on a row.
7. The size of the window can be changed by dragging the bottom-right corner to the desired height and width. If the new width and/or height of the window is greater than needed to contain the table, it will be automatically adjusted to fit. Hold the Ctrl key down to override this behavior.
8. One or more Parametric Tables can be printed using the Print command. However, if you wish to print only a selected range of the table, select the range in the manner described above and the press the right mouse button. The pop-up menu which appears has a Print Selected menu option.
9. The background color and a border around selected rows in the table can be can be changed by selecting the rows and clicking the right mouse button in the first column on one of the selected rows. A pop-up menu will appear having Background Color and Add Border as menu options. Rows can be inserted or deleted by selecting other menu choices in the pop-up menu.
10. Values in one or more columns of a Parametric table can be sorted in numerically increasing or decreasing order by clicking the right mouse button within the column header cell. A pop-up menu will appear having Sort as one of the menu choices.
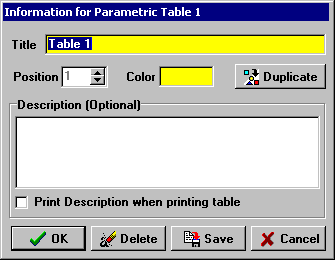
11. A table can be duplicated by right-clicking on the tab. A dialog will appear with a Duplicate button as shown below. This dialog also allows the position of the tab and the tab background color to be changed. An optional note consisting of up to 255 characters can be placed here for reference. The description will be displayed in a hint when the mouse moves over that tab for the table, making it easy to identify the contents of the table. The Save button allows the data in the table to be saved to an external file with or without the column names. Note that the position of a table can also be changed by dragging the tab in the Parametric table window to the left or right.

12. Normally, the equations in the Equations window are compiled once before the Parametric table calculations are initiated. Use of the $Recompile directive forces the equations to be recompiled for each row in the table. This capability is needed in rare circumstances when the equations are changed in each run.
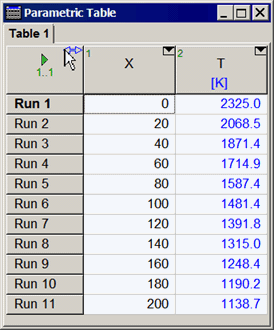
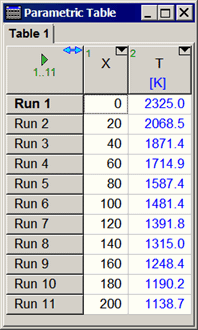
13. In the Professional license, all tables are equipped with a control to automatically resize the column widths. The control appears as a left-right arrow icon in the upper left cell of the table, as shown below. Clicking the icon causes all of the columns to be adjusted to a width that is just large enough to display all of the information the column. Clicking the icon again returns the column widths to their original values. If the Ctrl key is depressed when the icon is clicked, the column widths will be set to their default values.

