Sensitivity Analysis
The Min/Max command in the Calculate menu will find the values of a set of independent variables that minimize or maximize a specified variable, which is the objective function of the optimization process. However, a limitation of this optimization process is that it provides incomplete information. The optimum is found, but it is not known how broad the optimum is., i.e., how dependent is the optimum on the independent variables in the vicinity of the optimum. Sensitivity analysis has been provided in the Professional license to address this problem.
The Regen_MinMax.EES example file is used here to demonstrate the Sensitivity analysis and explain the options. Open this file and select the Min/Max menu item in the Calculate menu (or press F4). The Find Minimum or Maximum dialog will appear, as below.

This dialog provides the capability to select the optimization variable and the independent variables. In this problem, the optimization variable is the cycle efficiency (Eff) and the optimization variables are P[2] and P[4], the interstage pressures. Clicking the Bounds button will allow the limits on the independent variables to be viewed or changed.

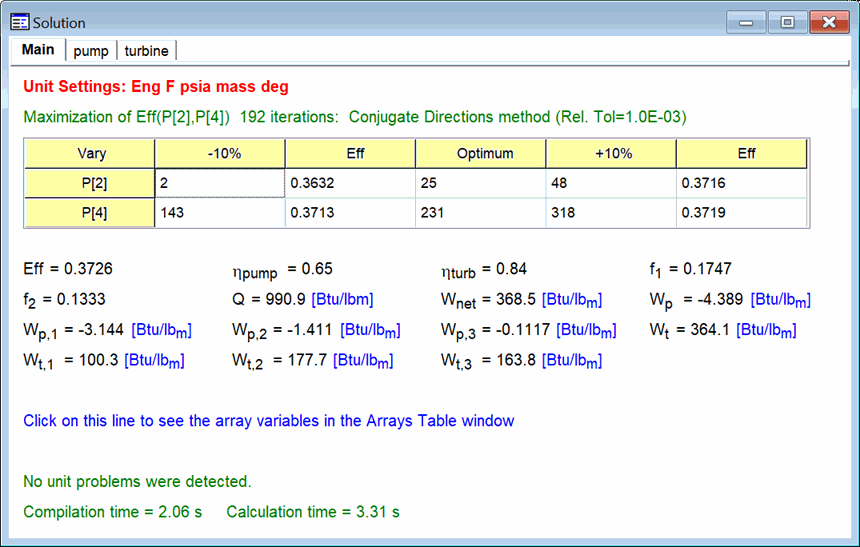
The controls for the Sensitivity analysis are below the Bounds button. Check the Display Sensitivities in Solution button if you wish to conduct the sensitivity analysis. The sensitivity analysis proceeds as follows. After the optimum is found, EES will vary each independent variable above and below its optimum by a user-specified percent of the range of the variable. The range is the difference between the upper and lower bounds. Each variable in varied by itself while all other independent variables remain at their optimum values. The value of the optimization variable is determined and displayed in the Main tab of the Solution window, as shown.

The optimum value of the optimization variable appears above the Sensitivity table (in green font) as well as in the Solution or Arrays window. The Sensitivity table provides a row for each independent variable. Each row provides the following information.
1. The name of the independent variable.
2. The value of the independent variable when it has been reduced by the specified percentage from the optimum.
3. The value of the optimization variable when the independent variable is at its reduced variable and all other independent variables are at their optimum values.
4. The optimum value of the independent variable (shown in bold font).
5. The value of the independent variable when it has been increased by the specified percentage from the optimum.
6. The value of the optimization variable when the independent variable is at its increased variable and all other independent variables are at their optimum values.
A review of this information identifies which the variable to which the optimum is most sensitive and the degree of sensitivity.